Tuesday 19 December 2017

China & India: Twin-Turbo for Global Growth?


The doomsayers will have to wait further for their collapse scenarios on China finally to materialize. The World Bank has just lifted its 2017 forecast for economic growth in China amid rising household incomes and a recovery in global trade[1].
China’s and India’s high growth has boosted global growth in recent years (Figure 1). From 2011 to 2015, China’s relative contribution to global growth was on a par with advanced countries, despite its per capita GDP growth falling from a top rate of 13.6 % in 2007 to 6.1 % in 2016. India’s contribution to global growth has also risen since the early 2000s, on the back of a per capita income growth rate oscillating between 8.8 % in 2010 and 5.9% in 2016. However, China has contributed almost 30% to global growth in recent years, approximately 20 percentage points more than India. As India is still considerably poorer than China, it cannot yet offset the impact of China’s slowdown on global growth and trade.

Figure 1: Contribution to global growth, 1991-2015, by areas (%)

Meanwhile, India has taken the lead over China in terms of GDP growth (but not per capita), with favorable demographics that encourage domestic savings and investment. In the future decades, Shifting Wealth may well benefit from a twin-turbo, China and India. Twin-turbo refers to the turbocharger configuration in which two identical turbochargers function simultaneously, splitting the turbocharging duties equally. Each turbocharger is driven by half of the engine's spent exhaust energy. A twin-turbocharger relying on China and India would be good news for convergence and for the world economy, counteracting the backlash emanating from populism and protectionism in the US and Europe.
Ever since the 1990s, there has been much talk about China´s growth slowing down. But China´s slowdown has been overhyped in Western media recently, while India has been celebrated as the new top-growth country. In per capita terms, however, China still leads India.  China´s growth has been coming down from unsustainable levels, while India´s growth has been rising, erratically so due to her exposure to weather conditions. In recent years, growth in both Asian giants has comfortably settled above 5 percent per annum.

Figure 2: GDP real per capita growth (annual %), 1990 - 2016


The June 2017 issue of the World Bank´s Global Economic Prospects predicts real GDP growth at 6.3 percent for both 2018 and 2019; India´s growth is forecast to reach 7.5 and 7.7 percent, respectively, in the two forthcoming years. Current annual population growth is 0.5 percent in China and 1.2 percent in India. So in real terms, per capita income growth is forecast to be superior in India than in China, albeit just by roughly half a percentage point.

Table 1: Percent of real global GDP Growth, forecast 2017 – 2019
China
35.2
USA
17.9
India
8.6
EU
7.9
Indonesia
2.5
Brazil
1.2
Russia
1.0

Even so, Table 1 suggests that India is still far from contributing to global GDP growth on equal terms with China. Mind you, India is forecast to contribute 8.6% to global growth (based on the cited World Bank numbers), and that exceeds the EU contribution. Meanwhile, China will support more than a third of world economic growth during the end of the current decade. 

Figure 3: Convergence to US GDP/cap, 1990-2016
Source: https://www.imf.org/external/pubs/ft/weo/2017/02/weodata/weoselgr.aspx


For the moment, the world economy doesn´t enjoy a twin-turbo China-India quite yet. India is still too poor to meaningfully contribute: its GDP/capita relative to the USA stood at 11.6 percent in 2016. China´s per capita income stood at 26.7 percent of US mean per capita income (Figure3). Compared to the US, among the five BRICS countries only China and India have converged to US per capita income levels since 1990 and 2016.

Figure 4: Trade (% of GDP)
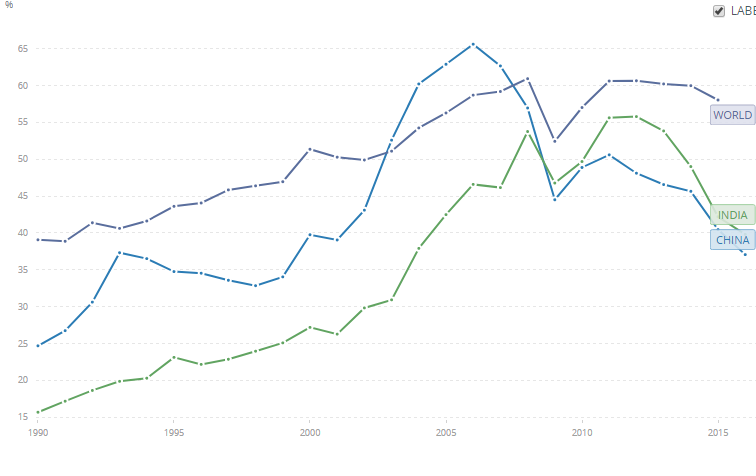


Another concern is that trade shares (% of GDP) have been dropping in India from 56 percent in 2012 to below 40 percent in 2016. India´s weak export performance reflects her dependence on commodity exports and a poorly diversified export basket[2].
To be sure, China´s trade shares have been dropping even more but this was a welcome outcome of rebalancing the country toward more consumption. In any case, the drop in trade shares observed in both Asian (Figure 3) giants translates domestic GDP growth mechanically into lower contribution to global growth. The twin-turbo support to the world economy in turn relies on an open trade system. With the US retreat from multilateralism under Trump, the twin-turbo engine is likely to stutter for a while.


[1] World Bank lifts China’s 2017 growth outlook, Financial Times, 19th December 2017.

[2] Understanding India’s export collapse, The Hindu Business Line, 21st November 2016.

Sunday 3 December 2017

Trump´s tax cuts mean ´we´ won´t beat global poverty

The US Senate’s approval on Saturday, 2nd December 2017, of big corporate tax cuts (from currently 35 to ca 20%) paves the way for a rehearsal of Reagonomics, in worse:
·         a ballooning US budget deficit (despite spending cuts for the American poor), according to the Congressional Budget Office and the Joint Tax Committee;
·         a further sugar high for stock markets and, possibly, short term growth;
·         a tighter US monetary policy to limit short-term diabetis (inflation pressures, bubbles);
·         rising US interest rates and a stronger US dollar;
·         depressing raw material prices in dollar-denominated markets.
Unlike Reagan, Trump is unashamedly protectionist, limiting any beneficial effects of the US tax cuts on US imports. Trade protectionism and the level of economic activity are important for developing countries, since they affect their exports and terms of trade. High real interest rates will dramatically increase the debt service burden of indebted developing countries; the appreciation of the US dollar will depressed commodity prices; developing-country terms of trade will mostly drop, implying an implicit income transfer away from commodity-dependent countries to commodity importers.

Table: Likely Impact of Trumps Tax Cuts on Africa
Net Foreign Assets/
Commodity Trade
High debt/tax ratio
Low debt/ tax ratio
Net FX reserves
Exporter
Ghana
Nigeria
Algeria
Importer
Turkey
India
China

The burden on the world´s poor will not be uniform. The table, inspired by van Wijnbergen´s (1985) analysis[1] provides a quick balance-sheet analysis of the impact of rising interest rates, a rising US dollar, and of falling commodity prices on some emerging countries. Ghana is an example of a country possibly worst hit by the US Tax cuts as it is a net oil exporter and carries a high net debt load. India and China should be much less affected in comparison by the US tax cuts as they are net importers of fossil energy and minerals, while they are less affected by a rise in interest rates. Whether they will benefit from any US expansion fueled by the tax cuts, is quite doubtful. First, it is quite unlikely that the US tax cuts will lead to a sustained; the Senate tax plan would merely cause faster economic growth -- about 0.8 percent more over the next decade, the Joint Committee on Taxation has found. Second, any important pass-through of US growth benefits abroad will be inhibited by Trump´s protectionism. With Trump, “we” can´t beat world poverty.


[1] Sweder van Wijnbergen (1985), “Interdependence Revisited: A Developing Countries Perspective on Macroeconomic Management and Trade Policy in the Industrial World”, Economic Policy, Vol. 1, No. 1 (Nov., 1985), pp. 82-137. http://www.jstor.org/stable/1344613

Monday 27 November 2017

Populism and Income Inequality in Europe

2016 shocked many with the election of President Trump in the US and the Brexit vote in the UK referendum. Since then, it is widely held that rising inequality may explain the march of populism in a number of recent elections, notably in Europe. Branko Milanovic´s famous elephant chart[i] is often used to support the notion that globalization, as suggested also by the Stolper-Samuelson theorem, has hurt the middle class in advanced countries to the benefit of China and other emerging countries. The Finnish think tank SITRA warns, however, that those who dominated the 75th-85th percentiles of the global income distribution in 1988 were not those in 2008. Then, that same bracket was primarily made up of middle class Chinese[ii].

Milanovic´s Elephant Chart
Source: Goodreads

A brilliant article in the New York Times[i] has just shown that the United States leads the income inequality league across OECD nations. There, the richest 1% to have roughly doubled their share of national income since 1980, to 20 percent in 2016. In Europe, it is in Britain where the richest 1% have extended their claim on national income the most during 1980-2016, from 6 to 14%. (The article also rejects some common misconceptions by showing that a rise in international trade - measured as a country´s import or export share of GDP - is associated with more income equality, not inequality.)
In 2017, however, the narrative that it is the rise in income inequality that explains populism has been scratched by election results in Austria or the Czech Republic, comparatively egalitarian countries that voted for populists nonetheless. Before that, fast growing Hungary and Poland with similar characteristics had turned to rightist populism.
The Timbro Authoritarian Populism Index claims to be the only Europe-wide comprehensive study that explores the rise of authoritarian populism in Europe by analysing electoral data from 1980. As their data show, “Authoritarian-Populism has overtaken Liberalism and has now established itself as the third ideological force in European politics, behind Conservatism/Christian Democracy and Social Democracy”. It provides numbers only for Europe.

 Top 1% Claim on National Income and Timbro Populism Index
Sources: Rothwell, NYT 17th 11. 2017 (based on World Income Database); Timbro Authoritarian Populism Index 2016; own calculations based on Spearman´s rank correlation and rho test as in  http://www.real-statistics.com.

I have collected the numbers from the New York Times article and the Timbro index in the table above. It allows me to carry out a back-of-the-envelope calculation of the Spearman rank correlation[ii] between rise and level of income inequality and the Timbro Populism Index. Not less, not more. The formula used for Spearman´s Rho is

Rho = 1- (6∑Diff_Sq)/(n3 – n),

with n = 12 and Diff_Sq denoting the squared difference in country ranking between the Timbro Index and the rise 1980-2016, and 2016 level, respectively, of the percentage share of national income captured by the richest 1% of each country´s population.

The Spearman Rho values are negative, not positive as most would expect, but statistically insignificant. Between the Timbro Populism Index and the rise of the percentage share in national income captured by the top 1%, Spearman´s Rho is = -0.357; for the level of the percentage share in national income captured by the top 1%, Rho is almost zero at -0.052.  The results for Spearman’s Rho are lower than the critical value for two-tail tests (n=12 => 0.406). I therefore have to reject the null hypothesis that there is a correlation between the 2016 Timbro Authoritarian Populism Index with either the rise 1980-2016 or the 2016 level of Income Inequality in a panel of 12 European countries. My back-of-the-envelope calculation certainly does not imply any causality. It may suggest, however, that other explanations, such as homogeneity in a fairly egalitarian (often small-country) context may encourage populist voting when people think their way of living is under threat.


[i] Branko Milanovic (2016), Global Inequality, Harvard University Press
[iii] Jonathan Rothwell, Dispelling misconceptions about what’s driving income inequality in the U.S, New York Times, 17th November 2017.
[iv] When data is not normally distributed or when the presence of outliers gives a distorted picture of the association between two random variables, the Spearman’s rank correlation is a non-parametric test that is preferred over the Pearson’s correlation coefficient.


Wednesday 22 November 2017

Exit, Voice and Christian Lindner

Christian Lindner, the 38 year old leader of the German party FDP, has been loathed massively since he announced his party´s exit from coalition talks with the CDU, CSU and the Green Party (the ´Jamaica´ coalition for the party colours black, green and yellow). The FDP says that weeks of talks had failed to produce a shared vision of government and that it would have had to abandon cornerstones central to its election platform, namely a lower tax burden, the gradual shut-down of coal-fired plants and a managed immigration policy. The document to be agreed on contained many square brackets at the end, indicating deep disagreements at the coalition talks.
The FDP had claimed a rapid phase-out of the so-called solidarity tax that is still raised to fund the economic development in eastern Germany - almost three decades after reunification. Partly the result of Merkel´s Energiewende, German industry still relies too heavily on coal and embarrassingly did not sign the Powering Past Coal Alliance at COP23. The freeze on family reunifications of refugees runs out next year, raising the prospect of a spike in new arrivals. These were substantial reasons for the FDP discontent with the coalition talks, although this motive is being widely denied by the smart alecks. Obviously though, the FDP felt that they did not have enough voice vis-à-vis the other parties so they preferred to exit the talks.
In his seminal Exit, Voice, and Loyalty: Responses to Decline in Firms, Organizations, and States, Albert O. Hirschman (1970) suggested that individuals dissatisfied with the performance of an organization they belong to or do business with may try to improve their lot either by ‘exiting’ from the organization and thus forgoing the goods or services it provides, or by remaining with the organization but attempting to improve its performance by ‘voicing’ their discontent. Political scientist Scott Gehlbach has provided a fertile game-theoretic model that treats the choice between exit and voice as a decision between costly policy options[1]. The model may shed some light on the static and dynamic effects of Lindner´s exit from the coalition talks.
The coalition talks can be represented as a bargain between four parties over policy outcome x for the new government. The bargaining game is not zero-sum, which means that all four parties have a common interest in avoiding exit. One peaceful outcome would be the Nash bargaining solution – gains from talks are split 25:25:25:25 between the four parties. x stands for ministerial portfolios and fringe benefits, for power to implement policies for the respective voter groups, etc. In this setting, Lindner´s FDP does not exit the talks.
In reality, there is a conflict of interest and programs between the potential coalition partners. To formalize Lindner´s exit decision, it is easier to use a reduced-form way of the bargaining model. In fact, ex post it could be argued that Lindner´s FDP has viewed the other parties as a (sort of social democratic) bloc. Assume that policy can take any value x between 0 and 1, where the FDP receives x and the three other parties (1-x) as long as there is no exit. In the event that the parties exit the coalition talks, the FDP receives payoff f and the other parties r.
In the Hirschman-Gehlbach model there are gains from trade: 1 - (f+r), with (f+r) < 1. Under the Nash bargaining solution (in the reduced form), the surplus from the coalition bargain is divided along (1 + fr)/2. The surplus received by the FDP ((1 + fr)/2 – f) equals that received by the other parties ((1 + fr)/2 – r). As emphasized by Hirschman, ‘the effectiveness of the voice mechanism is strengthened by the possibility of exit’. The possibility of exit (the payoff f from exit) increases the power of the FDP at the bargaining table, since the others must leave them with more to keep them from exiting. Hence, voice and exit are complements.
The payoff f for the Lindner´s FDP can be thought of as representation (of FDP ideas) and thus reputation (of keeping to the party line). This is an important payoff for a young, ambitious political leader. After all Macron exited the socialist Hollande government only to become President of France later. At the age of 38, Lindner is unlikely to limit his sight on the ongoing coalition talks.
Exit from coalition talks has always been a declared option for the FDP, which felt pushed into coalition talks as a result of the immediate (and perfectly understandable) SPD denial to even participate in coalition talks with Merkel´s CDU (the “vacuum cleaner of social democratic ideas”, according to Martin Schulz). Those who feel free to exit can use the threat of exit to magnify their political influence, or ‘voice’. Unless they would have felt ´loyal´ to the failed Jamaica coalition, that is. Loyalty (or ´responsibility´) is now a demand targeted at the FDP, a demand which is highly popular with the public media and those who never thought of voting for the FDP in the first place.
The Hirschman-Gehlbach model shows clearly that ´loyalty´ does not improve welfare unless it is heavily subsidized.  An increase in loyalty leaves bargainers unambiguously worse off when defined as an exit tax, while they may benefit from greater loyalty if it instead takes the form of a voice subsidy. An increase in loyalty – a decrease in f – would have allowed the other parties to take advantage of FDP reticence to exit by offering a less favorable treatment and less representation in a ´Jamaica´ government coalition. This may have been possible in the past under former FDP leadership; not for Christian Lindner. His exit payoff was just too big.


[1] Scott Gehlbach (2006), A Formal Model of Exit and Voice, Rationality and Society, Vol. 18(4): 395–418.

Wednesday 11 October 2017

SWFs for Germany: A crazy idea?

Small and medium income earners have few capital assets, have limited resources to save or smooth out income fluctuations, and are therefore unable to skim off risk premiums on assets. Political Germany has therefore recently been increasingly discussing the creation of a Sovereign Wealth Fund (SWF) as a solution to societal challenges such as increasing poverty among the elderly, increasing income and asset polarisation or intergenerational justice. Following Corneo's lead (2017)[1] and inspired by Thomas Piketty, it is now recommended that a broader diversified capital stock be built up with the creation of an SWF investing in securities and distributing the return annually to the population at equal amounts per capita without any further conditions than a minimum duration of residence in Germany.

The original motivation for the creation of SWFs was to preserve intergenerational justice in countries that exchanged their exhaustible natural resources for foreign exchange by extracting and exporting them. Without the establishment of sovereign wealth funds, such countries would have effectively used up their total assets at the expense of future generations, i. e. their total savings would have been negative[2]. But what is to be thought of sovereign wealth funds in countries such as China and Germany, which generate excess savings and export surpluses as a result of domestic investment and consumption deficits? Would the establishment of an SWF for Germany come at a favourable time in the long term? This essay tries to approach these questions.

World champion of net capital exports
Germany is not only the world champion in soccer, but also in net capital exports. The German current account surplus in 2016 amounted to 297 billion US dollars (268 billion euros) and China took second place with a surplus of 245 billion US dollars. Both China and Germany are characterized by a rapidly aging population. Rapid aging coupled with an aversion to immigration does incite to save for old age. Indeed, Germany's surpluses are structural in nature: since the turn of the century, it has not recorded a current account deficit; its domestic savings have always exceeded domestic investment. While China's current account surplus has been declining as a fraction of its GDP since the Great Financial Crisis, the German surplus has since then fluctuated between 6 and 8 per cent of its GDP.


In 2016, the German external surplus amounted to 8.5 per cent of GDP. As formerly in China, corporate savings, or rather corporate investment deficits, and the public sector budget have contributed to the high saving ratio in Germany[3]. In 2016, Germany saved 12.2 per cent of its disposable income; the savings rate of non-financial corporations was 4.3 per cent. The saving ratio of the consolidated government sector was 1.7 per cent, due to Wolfgang Schäuble´s 'Black Zero' policy. The corporate and government investment deficit and the consumer deficit corresponded to a savings surplus of 10.3 percent for Germany with the rest of the world. If Germany were a closed economy, it would suffer from a large demand deficit, low capital returns and deflation.

High returns are rarely achieved through massive net capital exports, however. Formerly known as a producer of 'cheap goods´, China has long been referred to as provider of 'cheap savings', which the country made available to the USA. As a large part of the FX reserves were invested in low interest rate US Treasury bonds and the US had (and still has) a corresponding current account deficit with China, China granted the Americans cheap vendor loans[4]. The accumulated FX reserves became a legacy burden due to the build-up of interest rate and exchange rate risks and the threat of the central bank losing monetary control.  This was followed by speculative bubbles on the real estate and equity markets. As a result, China turned part of its financial assets into tangible assets - through accelerated growth of sovereign wealth funds. According to the latest SWF Institute data, four Chinese sovereign wealth funds are among the top ten, with total assets of over USD 2 trillion at the end of September 2017, compared with Norway's Government Pension Fund Global, the world's largest single sovereign wealth fund, which has reached a total of USD 1 trillion[5].

Although Germany, as a member of the euro zone, does not hold exorbitant FX reserves, factors comparable to China have a negative impact on the economic return of its capital exports.  German banks and insurance companies have invested their savings in US subprime and Greek government bonds over the past few decades, resulting in heavy losses on these foreign investments. 2,200 billion euros have been invested abroad on a net basis since 2000, but in 2016 Germany's foreign assets amounted to only 1,600 billion euros. Germany's capital loss amounted to 600 billion euros, 7,500 euros per capita[6]. Since the outbreak of the euro crisis, German savings have no longer been transferred abroad primarily via commercial bank loans, but via public channels, as Germany´s voluntary private transfer dried up. Since then, the Deutsche Bundesbank's net foreign position has multiplied; at the end of September 2017, Target II claims amounted to around 850 billion euros. Since the beginning of 2016, the ECB has been paying interest zero percent on these balances.

In the autumn of 2017, after the German federal elections, the question arises as to how much German capital exports will collapse if the (liberal party) FDP's refusal to make the Eurozone a transfer union prevails. Would SWFs be a way out for Germany if its capital exports collapsed within the euro zone?

Dynamic inefficiency, aging and return on investment
For China and Germany, dynamic inefficiency can be diagnosed. An economy is dynamically efficient if gross investment income exceeds gross fixed capital formation on a sustained basis, whereby investment income is defined as the sum of profit, rent and interest income. If this is the case, then the financial sector will provide more resources for future consumption than it consumes. Conversely, if investments exceed investment returns, the financial sector withdraws resources from the economy. This is inefficient, because the whole purpose of investment is to increase future consumption opportunities[7].  In Germany today (as in China before) too little is being consumed. 

However, the creation and financing of SWFs from excess savings would only perpetuate the dynamic inefficiency in countries, such as Germany, where SWF financing does not derive from the export earnings of exhaustible raw materials (Arab Gulf States or Norway). SWFs that are financed from domestic demand deficits (instead of raw material revenues) do not therefore promote intergenerational justice but undermine it at the expense of today's generation.

In a closed economy where savings by definition equal investments, investment income would fall below investment expenditure as a result of excessive capital accumulation. If the return on capital falls below the growth or wage rate, a pay-as-you-go pension scheme is superior to funded pensions in a closed economy. To be sure, pay-as-you-go schemes for old-age pensions are largely influenced by changes in real wage growth and the ratio of contributors to pensioners (support ratio). The pay-as-you-go system is therefore essentially enclosed into the ageing economy and cannot escape the demographic pressure resulting from the expected drop in the support ratio, except by raising the retirement age.

However, even fully funded pension systems cannot escape demographic pressure, even if there are significant flows of capital between the ageing and younger parts of the world. Firstly, higher life expectancy will put pressure on the calculation of funded pensions. Secondly, the ageing of the population will exacerbate the pressure on returns by reducing the profitability of pension funds and insurance companies. An economic-demographic simulation model (MacKellar and Reisen, 1998) with two scenarios (relative self-sufficiency versus financial globalisation of pension schemes) predicts a decrease in the return on investment due to the fall in the labour force for both scenarios. In the autarchy scenario, the capital intensification associated with ageing will reduce investment income by 150 basis points by 2050 and by 110 basis points in the globalisation scenario[8].

Piketty (2011)[9] has postulated in his famous book, based on many years of empirical evidence, that the rate of return on capital, r, has usually been higher than the growth of production, g. If wealth is not heavily taxed or decimated by the consequences of war, the inequality r > g leads to a concentration of wealth, according to Piketty. The formula refers to the return on investment (r) to the growth rate (g), where r comprises profits, dividends, interest, rent and other investment income before taxes; g denotes the growth of disposable income or wages. Note that Piketty´s formula would preclude the formation of a middle-class, especially in fast-growing countries.

However, Piketty conceded that the tendency to higher wealth inequality was reversed between 1930 and 1975, in his judgement due to one-off circumstances. Interestingly, 1975 coincides with the beginning of the integration of 50 percent of the unskilled labour force into the world economy, triggered by the opening of China, India and the disintegration of the Soviet bloc (in my terms: Shifting Wealth Phase I).  A simple Cobb Douglas production function, in which capital contributes a third of the income (the rest is provided by unskilled labour and know-how), shows that doubling the global labour supply has reduced unskilled labour productivity by a good 16 percent[10]. This led to a corresponding reduction in equilibrium wage for basic skills. Meanwhile, the original wage effects of the integration of China, India and other emerging markets have been coming to an end.

It cannot be ruled out that "Piketty is history", as Goodhart and Pradhan predict in a recent BIS study[11], as longstanding demographic developments that caused income and wealth inequality will now change. This is supported by the fact that several trends, which have been valid for forty years since the entry of post-communist states and emerging Asian countries into the market-economy organized world economy, have ended. Goodhart and Pradhan forecast for the coming decades:
·         The ageing and shrinkage of the world's labour force (outside the Sahel Zone) and thus a higher share of wages in world income;
·         The decline in massive outsourcing to China and Eastern Europe, thus putting an end to price deflation for labour-intensive goods and hence provide scope for a more restrictive monetary policy in advanced economies, probably leading to asset price deflation; and
·         The trend reversal in the global development of factor relations with an increase in the capital ratio in production and a reduction in returns on capital[12].

Both pay-as-you-go and funded pension systems are being burdened by the ageing process (especially in Germany, China and Japan). However, the predicted improvement in real wages relative to return on capital discourages to persue wealth and generational equity by building SWFs. While pay-as-you-go systems of old-age provision will be less burdened by global wage trends, the projected reduction in the return on capital employed will put a strain on funded old-age provision and sovereign wealth funds.             


[1] Giacomo Corneo (2017): Ein Staatsfonds, der eine soziale Dividende finanziert, Freie Universität Berlin Fachbereich Wirtschaftswissenschaft, Diskussionsbeiträge 2017/13, Mai.
[2] Helmut Reisen (2008), How to Spend It: Commodity and Non-Commodity Sovereign Wealth Funds, OECD Development Centre Policy Briefs No. 38, OECD, Paris, September.
[3] OECD (2010), Perspectives on Global Development: Shifting Wealth, Figure 2.6., OECD, Paris; Statistisches Bundesamt (2017), Volkswirtschaftliche Gesamtrechnungen: Sektorkonten, Destatis, Wiesbaden.
[4] The term vendor loan needs to be handled with caution, as there is no bilateral link between current account and capital account balances in an open global economy; for example, the USA was not only indebted to China via its purchase of government bonds but also through loans provided by European banks.
[5] Chinas four SWFs listed by the SWF Institute are China Investment Corporation; Hong Kong Monetary Authority Investment Portfolio; SAFE Investment Portfolio; National Social Security Fund. See https://www.swfinstitute.org/sovereign-wealth-fund-rankings/
[6] Marcel Fratzscher (2017), „Der deutsche Sparirrsinn“, Die Zeit, 17.2.2017.
[7] See A. Abel,  G. Mankiw,  L. Summers , R. Zeckhauser (1989), „Assessing Dynamic Efficiency: Theory and Evidence“, The Review of Economic Studies, 56.1, Januar, S. 1–19. 
[8] Landis Mackellar und Helmut Reisen (1998), A Simulation Model of Global Pension Fund Investment, Technical Paper No. 137, OECD Development Centre, Paris.
[9] Thomas Piketty (2013), Le capital au 21e siècle, Editions Seuil, Paris.
[10] Helmut Reisen (2006), „Globalisierung, Proletariat und Prekariat“, Internationale Politik, January 2006.
[11] Charles Goodhart and Manoj Pradhan (2017), “Demographics will reverse three multi-decade global trends“, BIS Working Paper No. 656, Bank for International Settlements, Basel.
[12] Piketty (2013) argues that the capital deepening goes is compatible with an increase in the return on capital. This, however, requires a substitution elasticity between labour and capital greater than one.

Wednesday 30 August 2017

Europe´s ´Migration Partnership´ with the Sahel Zone

On 28 August, France's President Macron had invited the presidents of Niger, Chad and Libya to the Élysée Palace to find solutions to the refugee crisis. Also present: the leaders of Italy, Germany and Spain. The mini summit came up with a plan for the eschewal of African migrants. As it were, Macron, Merkel, Rajoy & co decided to extend the European external borders up to the Libyan coast and now even well into the Sahel zone: forefield control as a populist waste disposal instrument. No matter how cruel the reception camps. Euphemistic label: ´Migration Partnership´.
Berlin has an increased interest in Africa because it fears that immigration in the public is unpopular. In a recent survey on the Bundestag election 2017, there was no other topic (poverty, unemployment, crime) that worried the Germans as much as the immigration and integration of foreigners. Clearly more than half of the interviewees, 56 per cent, consider migration the greatest societal problem currently for Germany. In fact, the irregular migration to Germany and Europe - mainly via the Mediterranean - had increased strongly until 2015. To be sure, migration from Africa is still low compared to Africa´s total population and relative to the refugee wave from the Middle East. But African migration to Europe will rise.
Historical experience - formerly in Europe, East Asia and North America, but also in China and India - has shown a demographic transition pattern that is closely linked to economic development. In the preindustrial phase, high birth rates and high mortality rates cause weak population growth. In the first part of the demographic transition, mortality rates begin to drop while birth rates and population growth remain high. In the second part of the demographic transition, declining birth rates and declining death rates lead to a slowdown in population growth. In the (post-) industrial phase, low birth rates cause weak or even declining population growth.
In one world region, however, the demographic transition is still slow although per capita income has risen: Sub-Saharan Africa. Demographic standstill includes Africa's most populous state, Nigeria, which already has nearly 200 million inhabitants. South of the Sahara, the decline in birth rates is agonizingly slow: the figure fell from 5.1 per woman in 2000-05 to only 4.7 per cent in the period 2010-2015. By 2050, according to UN projections, Africa's population will double to 2.5 billion[1]. Medical advances and the expansion of health care systems have led to higher life expectancy but living standards remain low, not least because of the associated rise of total population. One has to fear that without birth control and vigorous educational measures for the young Africans part of the continent will stay in the first phase of the demographic transition for too long. Some African societies have been stuck in the Malthusian trap.
The migration potential of Africa, the total number of African migrants, is likely to rise from a demographic perspective as long as the population grows strongly. From an economic point of view, the willingness to emigrate will remain high due to lack of training and labor market opportunities for a growing working population. The IMF categorizes 85 per cent of African migrants as economically motivated, only 15 per cent as political refugees[2]. Politically, Africa's migration potential is fueled by government failure, instability, political persecution and human rights violations. The attractiveness of political stability, democracy, the rule of law and social policy in Europe explains part of the migration to Europe. The migration potential of Africa is also likely to increase from the ecological point of view because water scarcity and the degradation of soils will increase as a result of advancing climate change and growing population pressure. Whether the African migration potential will manifest itself in migration to Europe also depends on the absorption capacity of the African target regions (such as southern Africa and North Africa).
In fact, African migration has so far mainly remained within the continent. According to IMF data, the share of immigrant migrants in the total population in Africa is relatively low (2%) compared with the other developing countries (3%). The reason is simple: the poorest cannot afford to emigrate. It is Africa´s future migration dynamics that worries politicians most. Today, a total population of just fewer than one billion Africans translates into 20 million migrants. In 2050, it will be 50 million if Africa´s migration percentage stays at two percent and Africa's population rises to 2.5 billion. How many of them will leave Africa?
According to the cited IMF note, the proportion of African migrants who actually leave their continent has increased from a quarter in the last quarter of the 20th century to a third today. Their numbers ranged from one million in 1990 to today's six million. Population growth and the growing share of African exodus suggest that their number will rise to 20 million over the coming decades. Most Africans migrants want to go to Western Europe these days. European governments want to prevent this with all their might, at the cost of betraying their own basic humanitarian principles. “So sad.”