Public Debt Dynamics
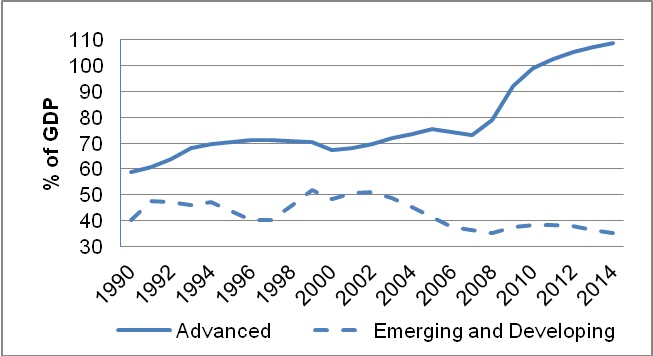
Source: IMF World Economic Outlook, October 2009
The remorseless accumulation of the global economic imbalances of the past decade has brought about a significant shift in the world’s wealth in favour of those countries running surpluses. These are often linked to fossil-fuel production or high savings and exports. The United States, a political and military leader in the world, finds itself (in common with some of its OECD peers) being financed by countries such as China, the Gulf states, Brazil and Russia—countries which until recently played no substantial role as international investors.
The United States is now the world’s biggest debtor: its net international investment position (NIIP–the difference between a country’s residents’ financial claims on the rest of the world and their equivalent liabilities) had sunk to minus USD 3.5 trillion by 2008, equivalent to 24 per cent of GDP. China (including Hong Kong) held more than a quarter of all US Treasury securities by the end of 2009—contributing to the more than half that were held outside OECD member countries (Table 6.2). China and other converging countries now fund the United States to a meaningful degree. The title of Cohen and DeLong’s book* (2010) points to the potential implications: The End of Influence: What Happens When Other Countries Have the Money.
* Cohen, S. and B. DeLong (2010),
The End of Influence: What Happens When Other Countries Have the Money, New York: Basic Books
The End of Influence: What Happens When Other Countries Have the Money, New York: Basic Books
Major Non-OECD Holders of US Treasury Securities
Holder | Holding (a) USD billions | Proportion of Total % |
China | 790 | 21.9 |
Oil exporters (b) | 188 | 5.2 |
Caribbean banking centres (c) | 188 | 5.0 |
Brazil | 157 | 4.4 |
Hong Kong, China | 146 | 4.1 |
Russia | 128 | 3.6 |
Non-OECD Total | 2 053 | 57.0 |
Source: http://www.ustreas.gov/tic/mfh.txt Data as at November 2009
No comments:
Post a Comment