Tuesday, 31 March 2020

Sovereign Wealth Funds under Corona Stress


Sovereign wealth funds (SWFs) have suffered heavy losses since the outbreak of the coronavirus pandemic; those losses were reinforced by an oil price collapse to lowest level since 2002. Sovereign funds from oil-producing countries mainly in the Middle East and Africa were estimated to dump up to $225 billion in equities, as plummeting oil prices and the coronavirus pandemic hit state finances. For 2020, the sum of SWF equity losses exceeds one trillion US dollars according to a Reuters report of 29th March.
How large was that loss in relative terms?
This is hard to tell with precision as the SWF industry is shrouded in secrecy. My hunch, though, is that SWF worldwide have seen their total assets plummet by one eighth (12.5%). Aggregate SWF assets had risen to US$ 7.45 trn by Spring 2018, the latest Preqin Sovereign Wealth Fund Review reported. I assume that total assets had continue to rise modestly until the sudden stop early this year.

Assets (US$ bn) Held by Top Ten SWFs, end 2019
Norway Government Pension Fund Global
1.099
China Investment Corporation
941
Abu Dhabi Investment Authority
697
Kuwait investment Authority
592
Hong Kong Monetary Authority
509
GIC Private Ltd Singapore
440
National Council Social Security Fund China
438
SAFE Investment Company China
418
Temasek Holdings Singapore
375
Qatar Investment Authority
328
Total Top Ten
5.837
Source: Statista


The table lists and ranks the top ten SWF by assets, roughly 75% of world assets under management by SWF, combined more than US$ 5.8 trn. Although China´s SWF assets combined were the largest (US$ 1.8 trn) even excluding the Hong Kong Monetary Authority Investment Portfolio, Norways SWF has retained the top position.

The Local Norway reported that Norway´s SWF had lost US$ 125 bn at current exchange rates for the Norway Krona. Its share portfolio, which accounts for about two-thirds of its holdings (equivalent to 1.5 percent of global market capitalisation), reported a 23-percent drop in 2020. Consequently, total assets of Norway´s oil fund have dropped below US$ 1 trn, a level first reached in 2017.

Yngve Slyngstad, the head of Norway´s fund manager Norges Bank Investment Management, announced that the drop in assets would trigger a so-called rebalancing rule, meaning that the SWF will in the long-term buy shares in the global equity markets. The fund’s equity quota, which was on target at 70% at the end of 2019, had fallen to just over 65%. However, does such a high share of equities make sense for the portfolio of an oil-fed SWF? I doubt it. At least, I would advise Norway to wait with equity reinvestment and rather stop extracting oil.

An oil-exporting country optimising production should be indifferent between keeping its oil underground (in which case the return is the expected rise in future oil prices) and receiving a market rate of return on its sale (Hotelling’s Rule for efficient depletion)[1]. The standoff between Russia and Saudi Arabia and the global corona recession have driven the oil price to historically low levels. Over recent years, ICE Brent Crude has cost between 60 and 80 US dollars per barrel. End of March 2020, it stood at around 21-13 US dollars. Eventual mean reversion would imply a rise of 300 percent over the next two, three years. While the Saudis keep on flooding the market, they run down capital, unless the receipts are fully reinvested in financial, physical or human capital (Hartwick’s Rule for intergenerational equity). But they won´t hurt themselves forever, which should mean higher oil prices as their flooding ends.

What can Norway´s SWF expect in terms of future equity returns over the next two, three years? Much depends on the shape of recovery – V, L, W, or U[2];[3]. To be sure, hardly the 300 percent rise it can expect for oil. The fund has been mainly invested in big caps such as Apple, Microsoft, Alphabet, Roche, Nestlé and Novartis. But let´s assume the Norway Government Pension Fund Global will simply buy the MSCI World to rebalance its portfolio to the equity quota of 70%. That index has dropped from 2400 and bottomed at 1600 in March, or 33%. To reach old highs, the MSCI World would have to rise by 50%. In case of V-shaped recovery of the world economy at least, the expected rise in oil prices would easily be superior than in global equities. If the world economy does not recover quickly as the coronavirus rambles on, both oil and equity prices will remain depressed at best.

MSCI World v Brent, March 2019 to March 2020


A more permanent point that militates against driving the equity share of oil-fed SWFs to 70% stems from basic insights of modern portfolio theory. It states that portfolio variance can be reduced by selecting securities with low or negative correlations in which to invest, such as stocks and bonds[4]. Indeed, the recent turmoil on both oil and global equity markets drove their correlation to high levels whereas AAA government bonds remained largely unaffected.


[2] Richard Baldwin & Beatrice Weder (2020), Economics in the Time of COVID-19, Voxeu, 6 March.
[3] Helmut Reisen (2020), Shifting Wealth in Times of the Coronavirus, ShiftingWealth blog, 8 March.

Tuesday, 24 March 2020

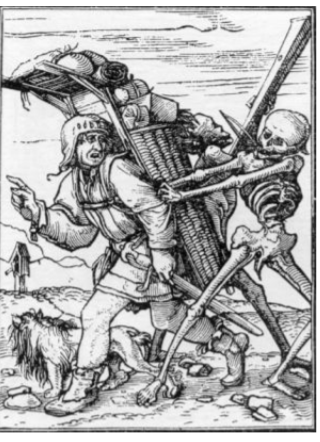
Die Seuche

Holbein d.J., Der Tod holt sich den Krämer, 1525
Die Seuche tobt, sie fegt die Straßen leer.
Jaulend streiten Katzen in der Nacht,
die seltsam still und schwarz.

Die Menschen sind im Hausarrest,
manche singen vom Balkon.
Ansonsten fügt man sich.

Gehorsam gegen Schutz,
Ordnung durch Disziplin.
"Dahoam is dahoam".

Tabellen, Charts werden verschlungen:
Tote, Infizierte, täglich Rekorde.
Börsen stürzen, Firmen schließen.

Stillstand, Arbeitslose, Heimarbeit.
Die Krankenpflege unterbezahlt,
Spitäler wurden lange ausgehungert.

Der Schwarze Tod als Referenz,
Pesthauben sind heute die Masken.
Virologen die neuen Stars..

Keine Zeit für Weltenbummler,
die Krämer stehen vor dem Aus.
Vom Boom zum Bust im Sturzflug.

Der Spuk wird zwar eine Ende finden,
doch wann, mit welchen Folgen?
Epochenwende 2020.

Sunday, 8 March 2020

Shifting Wealth in Times of the Coronavirus


A decade ago, we defined Shifting Wealth as the shift in the gravity of the world economy and as the switch in net foreign assets toward Asia. The gravity shift occurred as a result of superior GDP growth of economies with large populations (notably China and India, some 40% of world population) from the 1990s. The switch in assets resulted from structural deficits of the US that were financed by Asian saving surplus[1].
Starting with a deliberate China containment poliy from the early 2000s by the US and Japan in particular, reinforced by a clearly protectionist policy stance by the Trump administration, the 2019–20 coronavirus (also COVID-19) outbreak has the potential to end three decades of Shifting Wealth.
End 2019, the coronavirus was first identified in the Chinese Hubei province, in Wuhan. China has by far the highest number of coronavirus-related infections (80k), recoveries (57k) and deaths (3k); other countries hard hit are South Korea, Italy and Iran[2]. The Chinese purchasing manager index Caixin Services PMI in the services sector collapsed almost 50% as a result of the Corona Virus pandemic as economic activity came to an abrupt halt between January and February 2020.
As a result of Shifting Wealth, China plays a far greater role in global output, trade, tourism and commodity markets than only 20 years ago. This magnifies the economic spillovers to other countries from an adverse shock in China. In its latest Interim Projections, the OECD estimates China´s real GDP growth rate (year-on-year) to drop from 6.1% in 2019 to 4.9% in 2020, but then to recover to 6.4% in 2021. Under this optimistic scenario, the China´s growth delta would be restored quickly, and Shifting Wealth would continue, reinforced by India´s high growth. The OECD optimism is grounded on the assumption of a V-shaped recovery.
The key question now is whether the world will enjoy a V, just like a seasonal flu or a common cold from which people tend to recover quickly. There are other possibilities which, taken together, are more likely. A W-shape as people recover from coronavirus but then relapse; a long slump (U) as economic shock could cause lingering pain as the world economy digested the 2008 global financial crisis; finally, the world economy might suffer an L-shaped slump as it did after the 1970s oil shocks.
A ‘V-shaped’ hit seemed likely several weeks ago when infections were mostly a Chinese problem and China was dealing with it forcefullywith the coronavirus. While the spreading of the virus has now slowed down to a trickle in China, the virus is now multiplying rapidly in Europe, in the US and elsewhere. As of today (8th March), the coronavirus has hit 103 countries and territories around the world as well as the Diamond Princess cruise ship harbored in Yokohama, Japan. Many of these countries don´t have an efficient public health system (most prominently the US where testing is limited) or refuse to seriously engage in global solutions to the coronavirus crisis. On the altar of faith in the primacy of individual freedom and superiority of the market economy, strict quarantine campaigns are being launched too late or not at all[3]Finally, at this point it can´t be excluded that the coronavirus becomes endemic and becomes a periodic disease.
The best broad assessment about the economic fallout comes so far, in my view, from Richard Baldwin and Beatrice Weder di Mauro (2020)[4]. On the back of evidence and analysis by leading economists, their overall assessment is: “While a short-and-sharp crisis is still possible, it’s looking less like the most likely outcome”. By comparison, most German economists, money advisers and journalists still seem too complacent about the coronavirus threat. And they recommend what they always do: Keynesians demand stimulation, Ordoliberals warn against activism, financial advisors and journalists recommend not to sell but to keep on buying stoically (while the knife keeps falling). Financial markets are now reacting in a way that will impose additional pain on the real economy.
Baldwin and Weder discuss the virus in terms of the relative importance of supply vs. demand shock that determines the effectiveness of policy stimulus. They stress the supply-shock character of output disruption as supply shocks are more tangible, from an infected workforce via shuttered schools and workplaces, to hits to productivity. Countries at the core of global value chains (GVCs) are especially hard hit by the virus-induced slump in manufacturing output – next to China (at the GVCs center), these are South Korea, Japan, Taiwan, and Vietnam. These countries form the GVCs core and - via intense trade, banking and investment links with the G7 economies – dominate world GDP, manufacturing and exports. That dominance results, at least in the short and mid term, in global supply-side contagion. Industrial sectors hardest hit are likely to be the optics and car industries. Protectionist deglobalisation measures will deepen the slump as there is little official understanding of the global public goods character of open borders in times f the coronavirus.
The presumed dominance of supply-side shocks is not to belittle the demand effects of the virus. Immediate aggregate demand effects arise from suspended consumer purchases of goods and services for fear of viral contagion, such as cruise holidays or air travel, visits to rock concerts or theaters. Each of these first-round demand shocks are likely to be subject to Keynesian multiplier amplification. Not all demand, though, is gone definitely, as some demand is reoriented toward the internet.
Stock markets have taken long to discount for the unique economic effects of the coronavirus pandemic. The MSCI WRLD PI USD peaked on 12th February; since then, it has lost 12 % (only) but CBOE volatility has spiked and the US dollar has weakened against the funding currency euro as carry trades were dissolved and bond rate differentials shrunk. This is far from a financial market crash so far; should it come, negative wealth effects and pension returns will deepen the slump. Corporate bond markets have also started to price in default risk.
A sudden deglobalisation – and hence a structural break to Shifting Wealth – is still in the cards. Official deglobalisation measures that hinder the flow of goods, service and people could well make the economic effects of this pandemic more persistent: “in times of rising nationalism and populism, people’s fears and suspicions of ‘others’ might become a force for disintegration and deglobalisation”. 
The West could have benefited earlier from the Chinese experience. But parallel to protectionism, a chinaphobic attitude has developed in the West, which wants to deny itself insights from other systems, with finger pointing at re-education camps and surveillance cameras. At the same time, a great self-sufficiency was fed in the media regarding the supposed superiority of the West. If Western narrow-mindedness continues, the 21st century will finally become Asian.

Friday, 15 November 2019

How best to prepare for Merkel´s Africa Summit on 19th November in Berlin

Attending the Africa summit headed by Chancellor Angela Merkel in Berlin on 19th November?

Be prepared by reading „G20 Compact with Africa: The Audacity of Hope“, by Robert Kappel & Helmut Reisen, just released by Friedrich-Ebert-Foundation.


On 19 November, Chancellor Angela Merkel will once again welcome selected African heads of state and government to Berlin and talk to them about enhanced economic cooperation. The focus will once again be on the Compact with Africa (CwA).

The aim of the initiative launched by Germany in 2017 as part of the G20 is to improve the framework conditions for private sector investment in Africa and to pave the way for more direct investment (FDI). The Compact brings together selected African countries, international organisations (IMF, World Bank, African Development Bank) and bilateral G20 partners and focuses on country-specific reform agendas. Currently, 12 African states are part of the CwA: Benin, Burkina Faso, Côte d'Ivoire, Egypt, Ethiopia, Ghana, Guinea, Morocco, Rwanda, Senegal, Togo and Tunisia.

With the study, we follow on from a publication by the Friedrich-Ebert-Stiftung in 2017, entitled "The G20 'Compact with Africa' - Unsuitable for African Low Income Countries". Already then, we pointed out insufficiencies in the CwA approach and recommended improvements. As the title of the new FES study suggests, we believe that the Compact still has clear shortcomings - and now also against the background of the data available after two CwA years.


Wednesday, 4 September 2019

The Madness of G20 Policy Matrices for Africa


African governments do not drive the preparation processes of the G20 summits despite their participation as observers during those events. Africa remains “on the table” of the G20 instead of sitting at the table for global agenda-setting and rule-making (Leininger, 2017)[1], although the AAG is co-chaired by South Africa (with Germany) and the UN Economic Commission on Africa (with ACET and the OECD) also participates in the Compact with Africa (CwA). Whether “countries are displaying ownership of the commitments made, unlike in the case of structural adjustment programmes that were externally imposed”[2] (Sidiropoulos, 2019)? Doubts are validated by a close look at the CwA policy matrices for each of the CwA countries.
The guiding principle of CwA policy matrices is: “Improve framework conditions for private investment (domestic and foreign)”. In reality, the African CwA partner countries have been subject to a bewildering array of government actions and specific targets required from them. The table below refers to the policy matrices of the early implementation phase of the Compact initiative. They are far from reflecting the comprehensive task load required from the governments in African countries participating in the Compact initiative.
Table: Required actions, targets and foreign institional partners in 1st CwA Policy Matrices
- numbers, early 2018 -

Ethiopia
Ghana
Senegal
Government actions
26
22
28
Targets
16
34
28
Foreign ´partners´*
26
32
23
* International and foreign bilateral development institutions. Multiple entries included.

The table picks three countries: Ethiopia, Ghana and Senegal. But the problem of bureaucratic overburden and quasi-colonial interference is general. For all twelve CwA partners combined, the total number of each required government actions and policy targets as well as involved foreign partner institutions easily sums up to 300 in early 2018. In many cases, the number of required actions, targets and partners has been rising with each update of the country matrix.
The proliferation of policy actions required from the twelve CwA partners in each of the country policy matrices can be blamed for the fact that CwA country governments have been confused and thus fail to own the compact initiative[3]. The CwA iniative is rather owned by multilateral agencies, especially the World Bank´s IFC. They push their themes and indicators without G20 leaders bothering about prioritisation nor considering the severely limited government management capacities of most CwA partners. Multilaterals struggle to obtain mandates. It is no coincidence that each multilateral organisation tries to push the work areas and indicators that they ´own´ into the CwA country policy matrices.
Clearly, the intentions and postulates of the 2005 Paris Declaration and Accra Agenda for Action have been forgotten and ignored. The old burden imposed by prolific donor missions and meetings on the administrative elite in Africa has been resurrected by the Compact. The imposition of government actions and policy targets may be perceived as benign from a Western perspective; yet they have a post-colonial taste.
What is listed below is biased toward quantifiable, monitorable targets in the initial policy matrix for Senegal. The table, far from being comprehensive is annexed here to provide some flavour. Yet little is discernible in the policy matrix that would support the need for structural transformation via sectoral, rural-urban or informal-formal shifts. Finally, it is also noteworthy to point to potential inconsistencies and policy conflicts.

  • Macro stability trumps social cohesion in the CwA design. But is this a sustainable reform sequence?
  • Post- tax business profitability is to be raised to attract private inflows. But how does this policy target rhyme with an increased “tax take” postulated to mobilise domestic resources?
  • The policy target to slim down Senegal´s bureaucracy sits uneasily with the overload of ´Government action´, ´Indicators and targets´ & “Partners’ support” (euphemism for international organisations and bilateral aid agencies) stipulated in the policy matrix.
  • To safeguard Senegal´s public debt sustainability can interfere with the required bond market development to attract institutional investors. Likewise, promoting PPPs (and other blending instruments, such as guarantees) to facilitate infrastructure lending to the private sector can undermine sustainable fiscal space through the build-up of public contingent liabilities


  • APPENDIX


    Senegal Policy Matrix 28.02.2018

    Government action
    Targets 2019
    Indicators 2019
    1. Macro
    Reduce fiscal deficit
    < 3% of GDP in 2019
    3.0%

    Ensure debt sustainability
    Reduce current account deficit
    Policy Support Instrument program with the IMF to support the PSE
    IMF: “Broadly satisfacory”
    - but (single) public tender issues,
    - two of the
    six structural benchmarks (SBs) set for the PSI 7th review missed: (i) delays in the payment of taxes via mobile phones; and (ii) limited progress in lower tax expenditures.

    Improved tax collection
    Tax ratio >20% by 2020/22
    20.4%

    SEZ law
    50-year income tax holiday replaced with a 15 percent tax rate with no exemptions
    Done. CIT rate of 15%, exemption from the CEL, from import taxes and duties.

    Performance of public services
    - Improve from 10th to 8th in the Mo Ibrahim Governance rank
    - Improve to at least 50 in all percentile rankings of the WB Governance Indicators
    - Still 10/54.


    Not reached. Slipping in gov´t effectiveness, inter alia.
    2. Business
    Investor protection & disputes resolution
    - Reduction of trade dispute resolution timeframe from 680 days to 500 days
    - Fully operating Commercial Court implemented by 2019
    - Fully operating Electronic Register of Guarantees by 2019
    - n.a.


    - Dakar Commercial Court established.


    -n.a.

    Project preparation & use of standard clauses in PPP
    Double the share of FDI: from 3% of GDP in 2015 to 6% in 2020
    Trend FDI/GDP remins flat. Last observation 2018: 2.6%.

    - Simplify land registration procedures and transfer of ownership
    - Simplify and harmonize taxes and charges levied by local authorities
    - Electronic payment of fees for the administrative acts and taxes
    - Strengthen competition policy and practices in key sectors (telecoms, agribusiness, etc.)
    - Improve from 142 (2017) to 132 (2019) in the Registering Property indicator in Doing Business
    - Improve from 144 (2017) to 134 (2019) in the Enforcing Contracts indicator in Doing Business
    - Improve from 174 (2017) to 150 (2019) in the Paying Taxes indicator in Doing Business
    - Review of national competition framework vis a vis UEMOA
    - Enhanced competitive practices in key sectors, opening up markets for private investment
    Registering Property: easier => Rank = 118.


    - Flat: Rank = 142.


    - Flat: Rank = 171.


    - The inability to meet the PSI ceiling on the share of public procurement using sole source suggests that procurement could bestrengthened.
    3. Financing
    Attract institutional investors
    Support to the regional pilot project for market development (in CFAF) for long-term bonds; adapt regulatory texts by 2019
    1/7/19: Baobab Senegal issues bond for a total FCFA 10 billion (€ 15.2 million) subscribed at 100%, at 7 years, with a coupon of 7.50% per annum.

    Create a risk mitigation fund by issuing bonds
    Fully functioning mitigation fund, with a USD *** million initial capital, by end 2018.
    ?

    Address structural issues impeding lending to SMEs
    Reforms to require data to be shared with credit bureau (drawing on example in Cote d’Ivoire) and make collateral easier to recover.
    ?
    Sources:
    https://www.doingbusiness.org/content/dam/doingBusiness/country/s/senegal/SEN.pdf


    [1] Jutta Leininger (2017),"On the table or at the table?" G20 and its cooperation with Africa, in: Global Summitry Vol. 3 (2), pages 193–205.
    [2] Elisabeth Sidiropoulos (2019), “South Africa’s Changing Role in Global Development Structures – Being in Them but Not Always of Them”, DIE/GDI Discussion Paper No. 4/2019, page 30.
    [3] ACET (2019), Independent Review by The African Center for Economic Transformation, Compact Monitoring Report, April